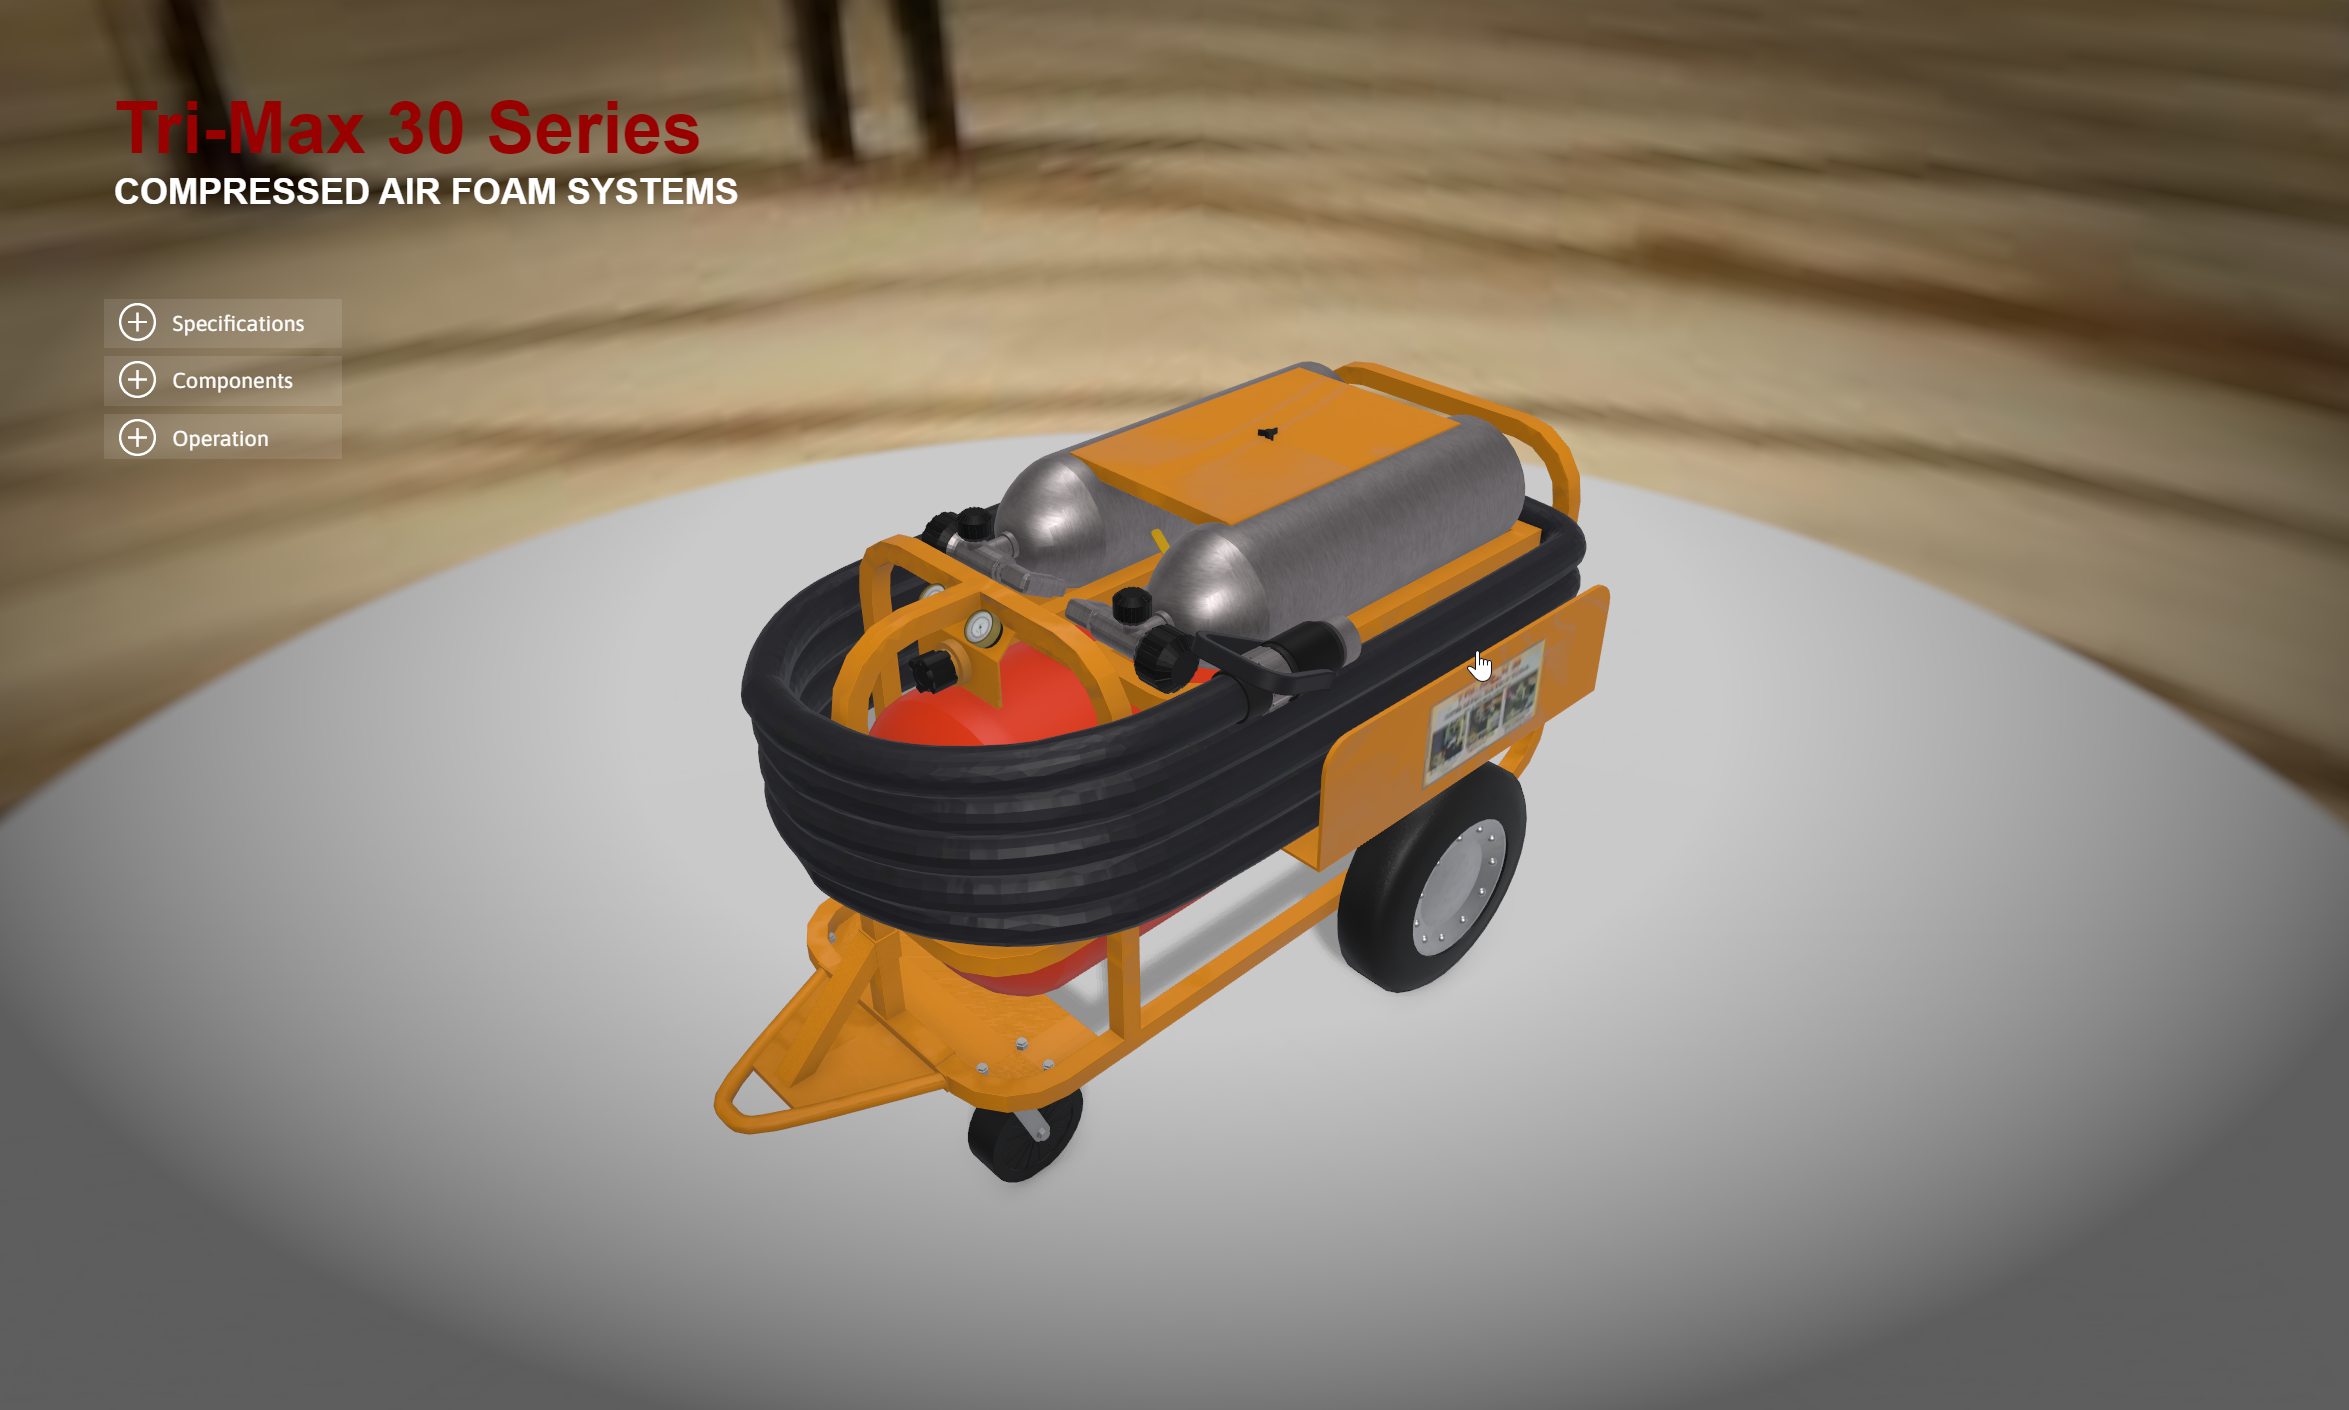
Adding a Dynamic Column Chart to Your Storyline Course

Enhance your e-learning courses with dynamic column charts using Google Charts and JavaScript! This step-by-step guide walks you through preparing your Storyline file, adding and customizing JavaScript code, and troubleshooting common issues. Learn how to visually display quiz results, engage students with animated charts, and personalize chart options to fit your needs. Perfect for educators looking to make their assessments more interactive and visually appealing.

Interactive 3D Model Demonstration

Project Name: Tri-Max 30 Series 3D Model Demo Description: This sample allows you to explore the Tri-Max 30 series fire extinguisher through an immersive interactive 3D demonstration. This demo is designed to illustrate the power of interactive 3D models for product familiarization and training purposes. You can engage with the intricacies of the fire extinguisher…

How to Add a Dynamic Progress Bar to Your Storyline Course Player

If you’ve ever wondered how to add a dynamic progress bar to your Storyline course player, you’re in the right place! In this step-by-step tutorial, we’ll walk you through the process, making it easy for both beginners and experienced e-learning developers to implement this engaging feature.

This dynamic progress bar will not only keep your learners informed about their progress but also enhance the overall user experience. Plus, the best part is that you won’t need to sacrifice precious slide space to achieve this.

Health Equity Explainer Video

Project Name: Health Equity Explainer Video Description: This animated explainer video serves as a concise guide to understanding the critical distinctions between four essential concepts: inequality, equality, equity, and justice. Extracted from a larger training video on health equity, this clip delivers a compact yet comprehensive overview of these concepts, laying the foundation for a…